#!/usr/bin/env python
"""
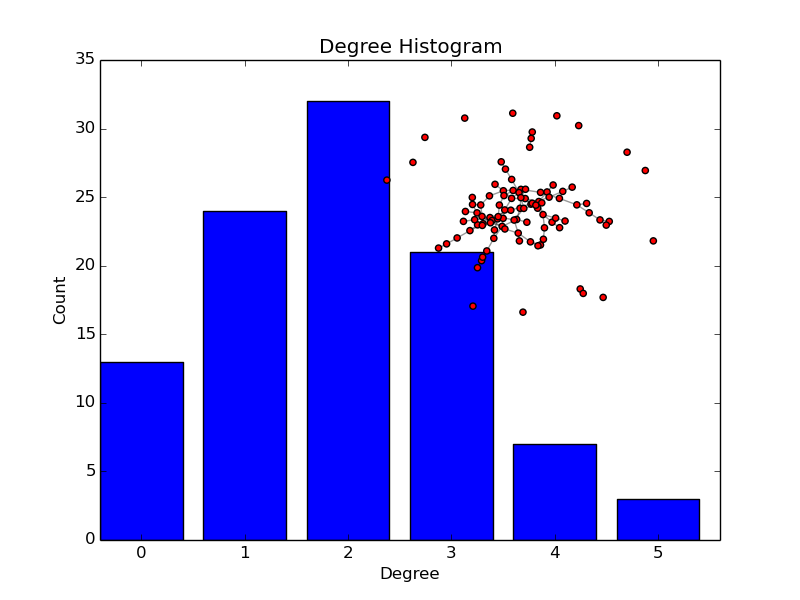
Draw degree histogram with matplotlib.
Random graph shown as inset
"""
import collections
import matplotlib.pyplot as plt
import networkx as nx
G = nx.gnp_random_graph(100, 0.02)
degree_sequence=sorted([d for n,d in G.degree()], reverse=True) # degree sequence
#print "Degree sequence", degree_sequence
degreeCount=collections.Counter(degree_sequence)
deg, cnt = zip(*degreeCount.items())
fig, ax = plt.subplots()
plt.bar(deg, cnt, width=0.80, color='b')
plt.title("Degree Histogram")
plt.ylabel("Count")
plt.xlabel("Degree")
ax.set_xticks([d+0.4 for d in deg])
ax.set_xticklabels(deg)
# draw graph in inset
plt.axes([0.4, 0.4, 0.5, 0.5])
Gcc=sorted(nx.connected_component_subgraphs(G), key = len, reverse=True)[0]
pos=nx.spring_layout(G)
plt.axis('off')
nx.draw_networkx_nodes(G, pos, node_size=20)
nx.draw_networkx_edges(G, pos, alpha=0.4)
plt.savefig("degree_histogram.png")
plt.show()